


Here is a question that does not get asked nearly enough during an SMB deal: where does this revenue actually come from, and is it still going to be there in two years? Headline revenue figures are easy to find. What is considerably harder to find and considerably more important is an honest assessment of how durable, diversified, and genuinely dependable that revenue really is.
At SMB VIG, we see this pattern repeatedly across our SMB deal investment steps: two businesses generating the same top-line revenue can have entirely different risk profiles, financing options, and long-term valuations. A $10M revenue business with 90% recurring, diversified contracts often commands a meaningfully higher multiple than a $12M revenue business built on a handful of large customers and constant re-bidding. The market prices predictability, and so do we.
This post walks through the SMB investment criteria we apply when evaluating revenue quality and explains why getting this right is one of the most important steps in any serious acquisition analysis.
Revenue Quality Is a Leading Indicator, Not a Footnote
The instinct in deal-making is to focus on EBITDA and growth rates. Both matter. But before you stress-test a margin or model a growth trajectory, it is worth asking a more foundational question: how confident are you that the revenue base is actually real?
Revenue quality influences nearly everything downstream. When revenue is predictable, lenders are more willing to extend financing on favorable terms which matters enormously in a leveraged transaction. When revenue is diversified across a broad customer base, the business is more resilient to any single customer relationship going sideways. When pricing power is strong, margins hold up over time rather than eroding with each contract renewal cycle.
In short, revenue quality is not a soft metric. It is one of the clearest indicators of downside protection and long-term value creation available in a private company setting. As part of our SMB deal investment steps, evaluating revenue quality comes early before we get deep into financial modeling because it frames how reliable every other number in the model actually is.
The 10 Dimensions We Evaluate in Our SMB Investment Criteria
Over time, our SMB investment criteria for revenue quality has coalesced around ten distinct dimensions. Each one tells a different part of the story.
Recurring Revenue and Forward Visibility
The starting point is always recurrence. How much of the revenue base comes from subscriptions, service agreements, maintenance contracts, or repeat purchase patterns that are predictable and reliable? We look at the percentage of contracted or repeatable revenue, the average length of customer relationships, and what the backlog looks like. Higher recurrence directly translates into lower volatility, which translates into higher multiples it is that straightforward.
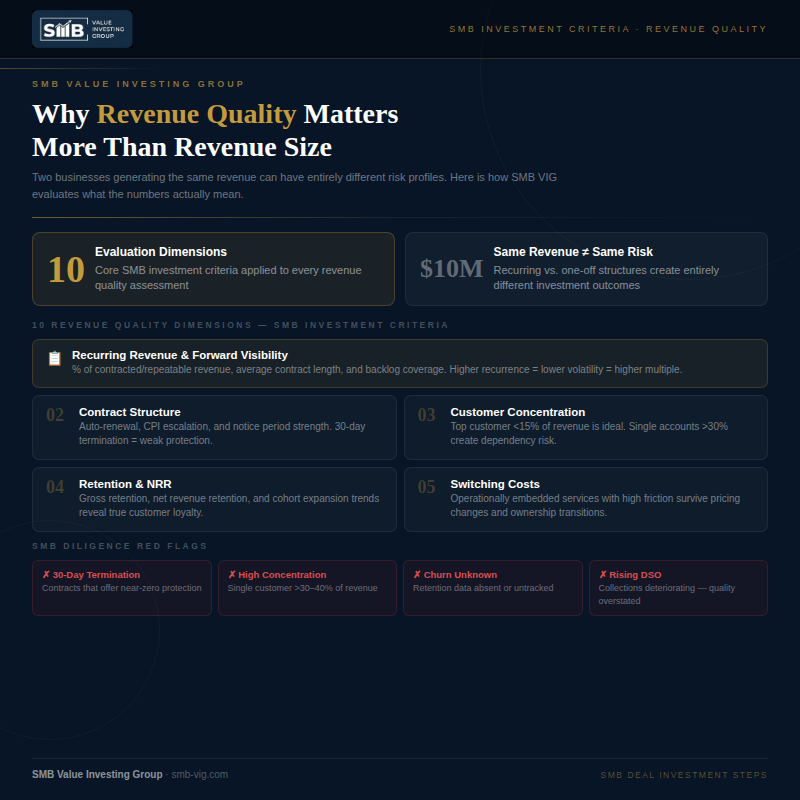
Contract Structure What the Agreement Actually Protects
Not all contracts are created equal, and this is one of the first places where revenue quality analysis separates thoughtful buyers from casual ones. A contract with a 30-day termination clause offers almost no protection. What we want to see are auto-renewal provisions, meaningful notice periods, price escalation clauses tied to CPI, and assignment provisions that survive a change of control. Without these structural features, “contracted revenue” can be little more than a polite description for revenue that happens to be documented.
Customer Concentration – The Hidden Risk
Recurring revenue concentrated in one or two large accounts is not the same as genuinely diversified recurring revenue. We look closely at the revenue contribution of the top 1, top 5, and top 10 customers, as well as geographic and vertical concentration. A diversified customer base is a real, underappreciated asset lenders and buyers reward it because it dramatically reduces the consequences of any single relationship deteriorating.
Retention, Churn, and Net Revenue Retention
Retention data is often the clearest window into actual customer satisfaction. Gross retention tells you how many customers stay. Net revenue retention accounting for expansion, contraction, and upsells tells you whether the existing base is growing in value over time. High-quality revenue typically shows low churn, stable renewals, and some meaningful upsell or cross-sell activity. When these numbers are unavailable or described as “not tracked,” that itself is a signal worth noting.
Switching Costs and Stickiness
Revenue is structurally higher quality when customers face real friction in leaving. Switching costs can be operational — when workflows and processes are embedded deeply enough that switching vendors creates genuine disruption. They can be financial, compliance-based, technical, or simply relationship-based when trust has been built over many years. Sticky businesses survive pricing changes, competitive pressure, and ownership transitions far better than businesses where customers have easy alternatives.
Mission-Critical vs. Discretionary Spend
One of the simplest and most important questions in any revenue quality assessment is whether the product or service is a “need-to-have” or a “nice-to-have.” Compliance-driven services, safety-critical operations, and operationally essential products have a fundamentally different risk profile than discretionary spending that gets cut early in a downturn. Mission-critical revenue is structurally more durable full stop.
Pricing Power and Real Price Growth
A business that can raise prices without losing customers has something genuinely valuable. We test this by looking at historical price increases and how customers responded, whether realized price growth has kept pace with inflation, what contract escalation clauses exist, and how much margin leaks through discounting. Pricing power is one of the strongest predictors of long-term margin stability, and its absence is often what causes SMB margins to quietly compress over time.
Revenue Recognition and Billing Quality
This dimension is more accounting-focused, but it matters. We look at revenue recognition practices, dispute rates, credit memo frequency, and DSO trends. Days Sales Outstanding is particularly telling when collections are deteriorating, it often means customer relationships are strained, the product or service is not delivering sufficient value, or the business is booking revenue too aggressively. In any of these cases, stated revenue quality is likely overstated.
Sales Process Maturity and Process-Driven Revenue
A recurring revenue base built on founder relationships is far more fragile than it appears. When a founding owner is the primary reason customers renew, new ownership inherits a dependency risk that no contract can fully protect against. As part of our SMB deal investment steps, we evaluate whether there is a real sales process in place CRM usage, defined pipeline stages, repeatable lead generation or whether the business relies on informal networks and personal goodwill that may not transfer easily.
Project-Based Revenue Not Always a Disqualifier
Not all project-based revenue is low quality. Some project businesses operate under long-term master service agreements with predictable pull-through, strong repeat customer history, and substantial backlogs. The issue is not project revenue per se — it is pure one-off, constant re-bidding situations where the pipeline is entirely unpredictable. A project business with disciplined backlog management and strong customer relationships can absolutely meet a rigorous SMB investment criteria threshold.
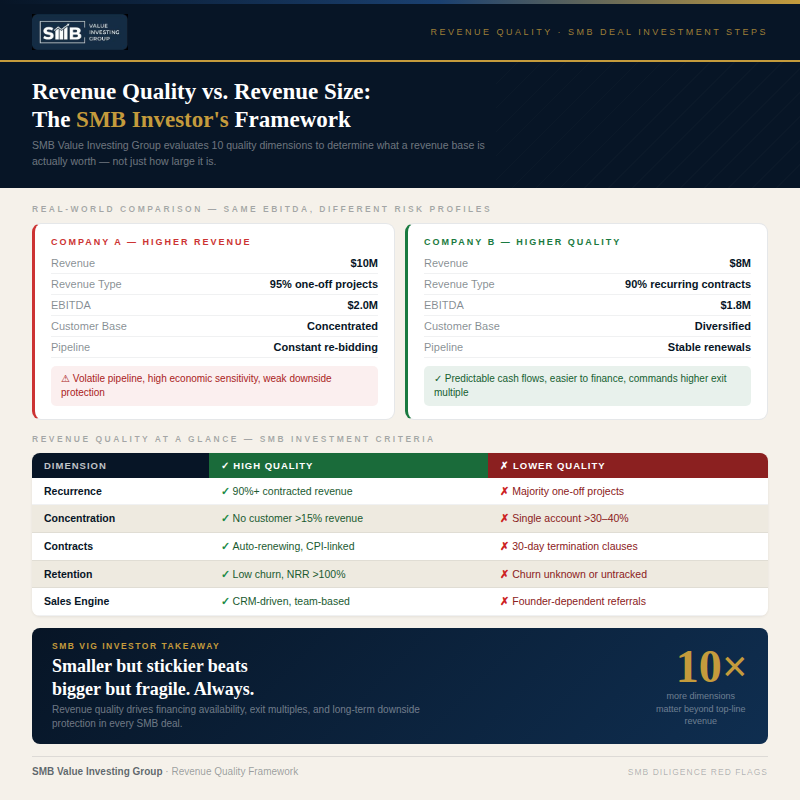
Revenue Quality: High vs. Low At a Glance
The table below summarizes how SMB Value Investing Group distinguishes between high-quality and lower-quality revenue across the key dimensions we evaluate in every deal.
| Dimension | ✓ High Quality | ✗ Lower Quality |
| Recurrence | 90%+ contracted/recurring revenue | Majority one-off or project-based |
| Contract Terms | Auto-renewing, CPI escalation, strong notice periods | 30-day termination, easily cancellable |
| Customer Concentration | Top customer <15% of revenue; diversified base | Single customer >30–40% of total revenue |
| Retention / NRR | Low churn; net revenue retention >100% | Churn unknown or untracked |
| Switching Costs | Operationally embedded; high friction to leave | Easy to swap out; commodity-like offering |
| Revenue Type | Mission-critical, compliance or safety-driven | Highly discretionary; first cut in downturns |
| Pricing Power | Regular increases absorbed without customer loss | Heavy discounting; price increases trigger churn |
| Billing Quality | Low DSO; minimal disputes or credit memos | Rising DSO; frequent write-offs or adjustments |
| Sales Process | CRM-driven; repeatable; team-based | Founder-dependent; referral-only pipeline |
| Project Revenue | MSA-backed pull-through; strong backlog history | Pure re-bid; unpredictable pipeline |
Same EBITDA, Different Worlds: A Real-World Illustration
Consider two companies, each generating around $1.8–$2.0M of EBITDA. Company A brings in $10M of revenue, the majority of which comes from one-off projects that require constant re-selling. Company B generates $8M of revenue, with 90% under recurring contracts and a diversified customer base where no single account exceeds 12% of revenue.
In practice, Company B will almost always command a higher exit multiple. The math is straightforward: its cash flows are easier to underwrite for lenders, the revenue base is easier for buyers to model with confidence, and the business is less exposed to a single bad quarter or lost account. Revenue quality creates financing optionality, which expands the buyer pool, which drives valuations higher. This is precisely why our SMB investment criteria treats revenue quality as a primary input not an afterthought.
SMB Diligence Red Flags We See Most Often
Across our deal reviews, certain SMB diligence red flags appear repeatedly and most of them relate directly to revenue quality. The most common is contracted revenue that, on closer inspection, carries 30-day termination clauses, rendering the contracts largely symbolic. Close behind is heavy customer concentration, where a single account represents 30–40% or more of total revenue. Churn data that is either absent or dismissed with a casual “we don’t really lose customers” is another warning sign mature businesses track this meticulously.
Other SMB diligence red flags include revenue spikes near year-end that suggest aggressive cutoff practices, rising DSO trends that indicate collection problems masked by accrual accounting, and heavy reliance on the selling owner for key renewals. Any one of these is worth investigating carefully. When multiple appear together, they collectively paint a picture of revenue that is considerably more fragile than the headline number suggests.
The Bottom Line for SMB Investors
Revenue quality is the strongest leading indicator of downside protection and long-term value in SMB investing. At SMB Value Investing Group, we would consistently rather back a smaller business with recurring, diversified, sticky, mission-critical revenue than a larger business dependent on constant reselling, concentrated accounts, and founder-held relationships.
Size attracts attention. Quality sustains value. And in the kind of lean, founder-owned businesses that define the SMB market, the gap between those two things is often wider than a quick revenue scan will reveal. The SMB deal investment steps that matter most are the ones that go beneath the headline and that is precisely where our diligence process is designed to go.