


For investors who have spent years chasing yield in crowded markets, the SMB investment landscape offers something genuinely rare: high, cash-flow-backed returns in a structurally inefficient space that most institutional capital still ignores.
At SMB Value Investing Group, we spend a great deal of time explaining why small and mid-sized business acquisitions deserve serious consideration as a core private market strategy rather than a peripheral alternative. The performance data is compelling, but the real story is structural. This article walks through what the numbers actually show, why the returns exist, and how they compare honestly to the other major asset classes competing for your capital.
What Four Decades of Data Actually Shows
The cleanest long-run dataset on professionally executed SMB acquisitions comes from the search fund model, which has been tracked by Stanford Graduate School of Business since the mid-1980s. The 2024 edition of that study covers 681 search funds and delivers a remarkably consistent story over time.
| Metric | Value | Notes |
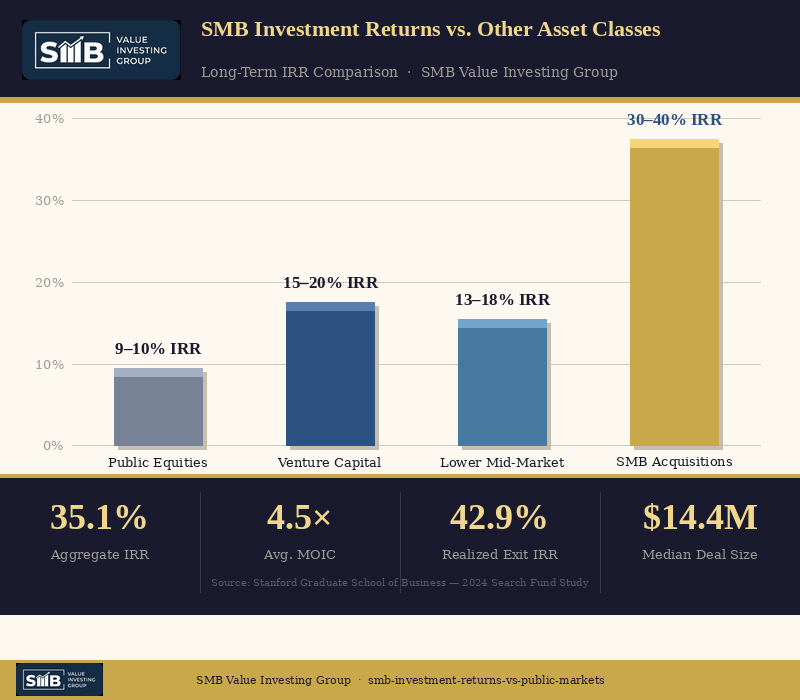
| Aggregate IRR | 35.1% | Across 681 search funds, 1984–2024 |
| Average MOIC | 4.5× | Down from 5.2× in 2022 |
| IRR – Realized Exits | 42.9% | Up from 36.8% in prior period |
| Median Acquisition Size | $14.4M | Enterprise value at acquisition |
| Median Entry Multiple | 7.0× EBITDA | Recent transaction data |
| Avg. EBITDA Margin | 27% | At time of acquisition |
| Avg. Revenue Growth | 25% | Annual growth rate |
When deals successfully reach exit, the IRR climbs to 42.9%, up from 36.8% in the prior study period. That gap between the portfolio average and the realized exit average tells you something important about how this asset class works: execution quality is the gating factor.
For investors evaluating the value investing for SMBs thesis, that distinction matters. This is not a strategy where market beta carries you. Returns are earned through process, not passivity.
Understanding the Full Return Distribution
Averages are useful, but in private markets the distribution of outcomes is the real story. Across realized SMB acquisitions, the pattern looks like this:
| Return Outcome | MOIC Range | Share of Deals | Interpretation |
| Exceptional Winners | 10× and above | ~11% | Outsized exits — strategic sale or platform roll-up |
| Strong Performers | 5× to 10× | ~25% | Solid operational improvement with clean exit execution |
| Base Case Returns | 2× to 5× | ~36% | Core of portfolio — predictable, cash-flow-driven outcomes |
| Modest Returns | 1× to 2× | ~27% | Capital preservation with limited upside; operational challenges |
| Losses | Below 1× | ~31% | Partial or total loss; concentrated in execution failures |
The loss rate, at roughly 31%, sounds alarming until you place it in context. In venture capital, loss rates on individual positions routinely exceed 60 to 70 percent. The critical difference is that in SMB investing, the winners do not need to be unicorns to offset losses. A 3× or 5× return on a cash-flowing business is entirely achievable without a speculative binary outcome.
“The risk profile in SMB investing is idiosyncratic and execution-driven, not market-driven. That changes the entire calculus for investors who understand what they’re actually buying.”
How SMBs Stack Up Against Every Major Asset Class
Context matters when evaluating any SMB investment opportunity. Here is an honest side-by-side comparison of what each major asset class typically delivers and what drives those returns:
| Asset Class | Typical IRR | Key Return Driver | Primary Risk Factor |
| Public Equities (S&P 500) | 9–10% annualized | Market beta, earnings growth | Valuation sensitivity, macro cycles |
| Venture Capital (Pooled) | 15–20% | Power law outliers | Binary outcomes, high loss rates |
| Lower Middle Market PE | 13–18% | Leverage, multiple expansion | Competitive entry pricing, rate sensitivity |
| SMB Acquisitions | 30–40% IRR / 3–5× MOIC | Operational improvement, efficient entry | Execution quality, key-man concentration |
The comparison above reflects what SMB Value Investing Group considers the defining advantage of this strategy: you are buying cash-flowing businesses at 3 to 6 times EBITDA in a market that institutional capital largely cannot access, and creating value through operations rather than financial engineering.
Why These Returns Are Structural, Not Cyclical
Skeptics sometimes argue that SMB outperformance reflects a particular market era rather than a durable structural advantage. The data does not support that reading. The core drivers of SMB alpha have been consistent across rate environments, economic cycles, and decades.
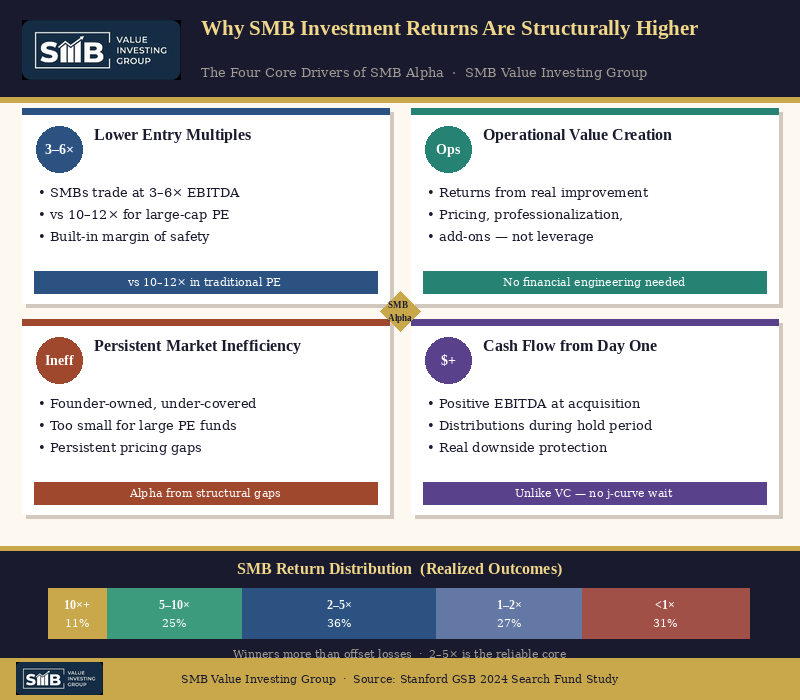
Entry Multiple Advantage
The median entry multiple in recent transactions has been approximately 7.0 times EBITDA, with average EBITDA margins running around 27 percent and average growth near 25 percent. Compare this to large-cap PE transactions regularly clearing 12 to 14 times. The gap in entry pricing alone creates a structural margin of safety that public market or traditional PE investors simply do not have access to.
Operational, Not Financial, Value Creation
Returns in the small business investment process are earned through professionalization, pricing discipline, cost structure improvement, revenue quality enhancement, and strategic add-on acquisitions. The value is created inside the business, which means it is less sensitive to public market conditions, interest rate cycles, and sentiment shifts.
Persistent Market Inefficiency
The SMB market remains structurally underserved. Most targets are founder-owned businesses navigating succession, too small for large private equity funds and too complex for individual buyers without operating experience. These conditions create persistent pricing inefficiency that disciplined buyers with a repeatable small business investment process can exploit over time.
At SMB Value Investing Group, we have found that this inefficiency is not diminishing as more capital enters the space. The 94 new search funds launched in 2023, a record figure, have so far increased overall deal activity without meaningfully compressing entry multiples in the sub-$20M enterprise value segment.
Cash Flow as the Fundamental Differentiator
One element that separates SMB investing from venture capital in particular is the presence of positive EBITDA from the moment of acquisition. The businesses being acquired are not pre-revenue growth stories requiring years of capital before generating returns. They are operating companies with established customers, recurring revenues, and real margins.
For investors exploring value investing for SMBs, this cash flow dynamic is not a minor feature; it is central to why the risk-adjusted return profile looks the way it does. It materially reduces the probability of total capital loss and allows for distributions during the hold period reducing the J-curve drag that characterizes most PE and VC fund structures.
Our View at SMB Value Investing Group
We do not view SMBs as a niche tactical allocation. We view them as a core private markets strategy that remains chronically underallocated in most institutional and family office portfolios because the deal sourcing, underwriting, and operational infrastructure required to execute well is genuinely difficult to build.
The SMB investment opportunity is real, but it rewards those who approach it with discipline. That means conservative capital structures, rigorous underwriting, strong operators, and clear exit visibility before capital is deployed.
When those elements are in place, the combination of efficient entry pricing, operational value creation, and cash-flow-backed returns produces outcomes that are difficult to replicate in any other segment of the private markets.
The Bottom Line for Investors
The performance record for SMB acquisitions spans four decades and multiple market cycles. The outperformance relative to public equities, traditional private equity, and venture capital is not a function of extraordinary luck or favorable timing. It is a function of buying good businesses at sensible prices, operating them with discipline, and compounding value over time through a structured and repeatable investment process.
For investors who want genuine alpha, cash-flow-backed returns, and exposure to a segment of the economy that is both large and persistently inefficient, the data makes a compelling case. SMB investing belongs in the conversation as a primary private market allocation, not a secondary one.